Heat Map Data Visualization Design - Fort Lauderdale Area Coverage Analysis
South Jasmine Drive Lake Charles, Louisiana 70605
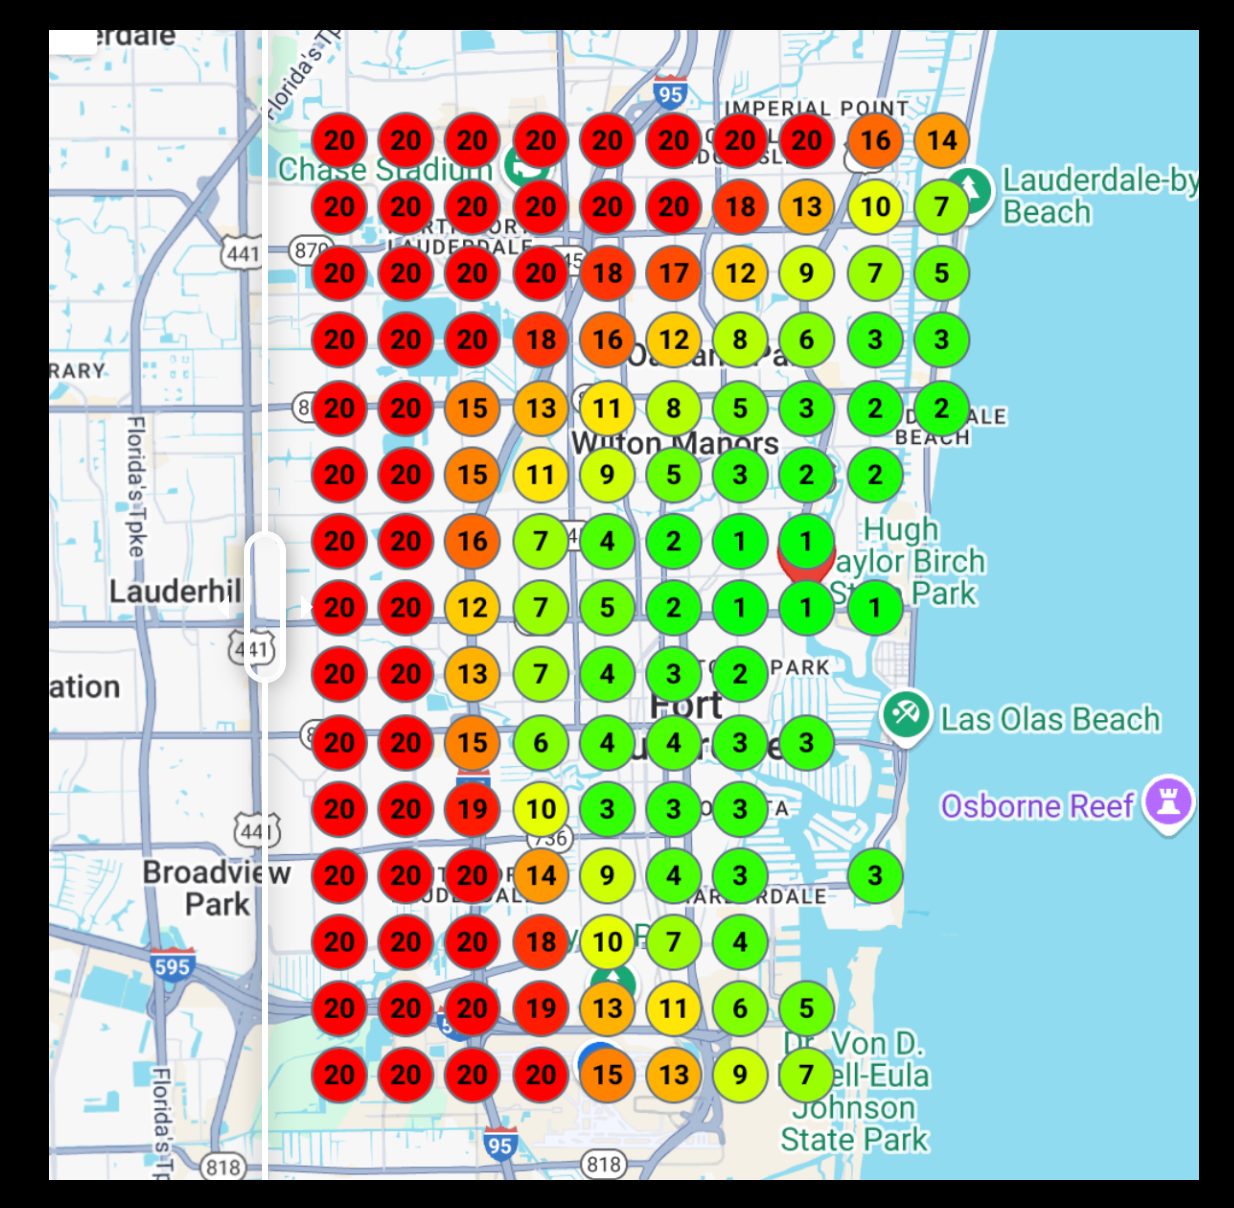
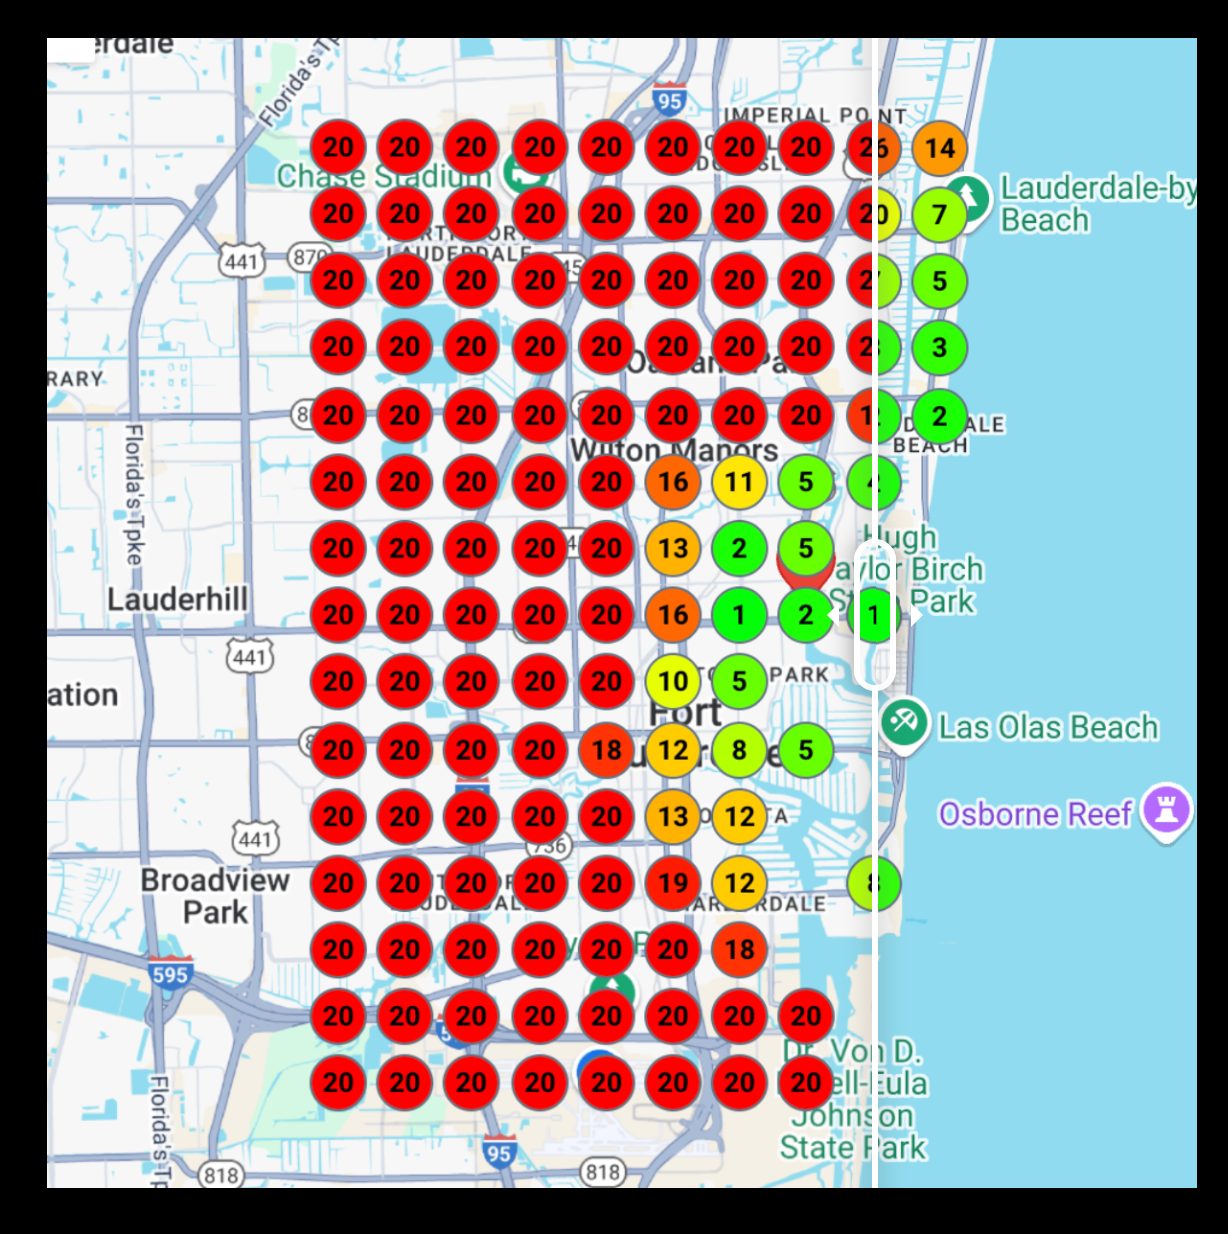
Graphic Works completed a before-and-after data visualization design project featuring geospatial heat maps of the Fort Lauderdale, Florida metropolitan area. The first map displays a heavily saturated red grid overlay indicating high-density or maximum-value data points across the region. The second map shows a refined, graduated color-scale version transitioning from red through orange, yellow, and green, illustrating improved data gradient visualization with more nuanced zone differentiation. Both maps cover the area spanning from Lauderhill to Lauderdale-by-the-Beach and from Imperial Point to Dr. Von D. Mizell-Eula Johnson State Park.
More Recent Work

Starbucks Cup Before and After Design Documentation - Lake Charles

Commercial Window Decal Installation for Building Services Company - Sulphur

Custom Trailer Wrap Installation for Southern Customs - Lake Charles
Get a Free, No-Obligation Estimate
Fill out the form below and we'll get back to you promptly.